View Population pyramid and over 3,000,000 other topics on Qwiki.
Population Pyramid
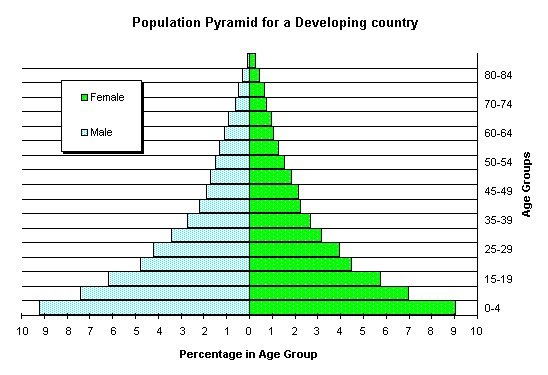
Population pyramid is a graph that shows the age and sex structure of a population
Broken into 5 year intervals called cohorts
Expanding = more children than adults eg. Developing countries
Stable = balanced throughout
Contracting = growth rate is below replacement level
Canada’s population is getting older and hence contracting
Broken into 5 year intervals called cohorts
Expanding = more children than adults eg. Developing countries
Stable = balanced throughout
Contracting = growth rate is below replacement level
Canada’s population is getting older and hence contracting
Summary
Population pyramids are graphs which show the age and sex of populations. The graphs are organized into five year intervals called cohorts. They typically consist of two back-to-back bar graphs, with the population plotted on the X-axis and age on the Y-axis, one showing the number of males and one showing females in a particular population. There are three types of these pyramids: Expanding: which is when there are higher numbers of children then adults. Usually developing countries have these, what with so many births due to no contraceptive and a low life expectancy. Balanced, which is when the population is balanced throughout, and Contracting, which is when there are less people being born and a larger elderly population. Usually developed countries have this because the life expectancy is higher and families are smaller.